Difference between revisions of "How to debug your code"
From Joomla! Documentation
Purplebeanie (talk | contribs) m (Adds a little more information about JDebug) |
(→The Easy Way 2 (joomla message): code style..) |
||
| Line 15: | Line 15: | ||
==The Easy Way 2 (joomla message)== | ==The Easy Way 2 (joomla message)== | ||
Your code won't always display simple echo statements. In that case you can try this alternative, still easy way: | Your code won't always display simple echo statements. In that case you can try this alternative, still easy way: | ||
| − | <source lang="PHP">JFactory::getApplication()->enqueueMessage( 'Some debug string(s)');</source> | + | <source lang="PHP">JFactory::getApplication()->enqueueMessage('Some debug string(s)');</source> |
You can choose different [[Display_error_messages_and_notices|message types]] which corresponds to grouping with different styles (colors mainly). | You can choose different [[Display_error_messages_and_notices|message types]] which corresponds to grouping with different styles (colors mainly). | ||
Revision as of 23:20, 30 June 2014
This article is tagged because it NEEDS IMPROVEMENT. You can help the Joomla! Documentation Wiki by contributing to it.
More pages that need help similar to this one are here. NOTE-If you feel the need is satistified, please remove this notice.
Reason: Updated Joomla! System-debug plugin features not listed here.
The Easy Way 1 (echo)[edit]
The simplest way to see what is going on inside your code is to temporarily add echo statements for variables to show their values on the screen. For example, say you want to know what the value of some variables are when $i is "5". You could use code like this:
for ( $i = 0; $i < 10; $i++ ) {
	if ( $i == 5 ) {
		echo '$i=' . $i;
                // other echo statements
	}
}
This works for simple situations. However, if you are planning on doing a lot of Joomla! development, it is worth the effort to install and learn an integrated development environment (IDE) that includes a real PHP debugger.
The Easy Way 2 (joomla message)[edit]
Your code won't always display simple echo statements. In that case you can try this alternative, still easy way:
JFactory::getApplication()->enqueueMessage('Some debug string(s)');You can choose different message types which corresponds to grouping with different styles (colors mainly).
Using an IDE[edit]
Check this 3 minutes video that shows how you can debug your code with a Browser and an IDE
Many Joomla! developers use the Eclipse IDE. This is free and includes a debugger. Instructions for installing it are available at Setting up your workstation for Joomla! development.
Using the PHP Expert editor[edit]
Another option is the PHP Expert editor with an installed extension for debugging. Add the following lines to the php.ini file:
extension=php_dbg.dll
[Debugger]
debugger.enabled=on
debugger.profiler_enabled=off
It is best to set profiler_enable to "off". Then you need to set options in the Run/Options menu to use HTTP-server and the directory in which your script is located.
If all options are correct, you may run your script in debug mode by clicking on the Debug button (F8)
J!Dump[edit]
An often handy extension that can be found in the JED is the J!Dump extension that will allow you to dump variable, stack traces, and system information into a popup window at run time. This extension works like the PHP command `var_dump` but formats the output in a much more readable fashion.
JDEBUG[edit]
To check whether the Website is in the debug mode, test the JDEBUG variable:
if(JDEBUG){
//whatever debugging code you want to run
}
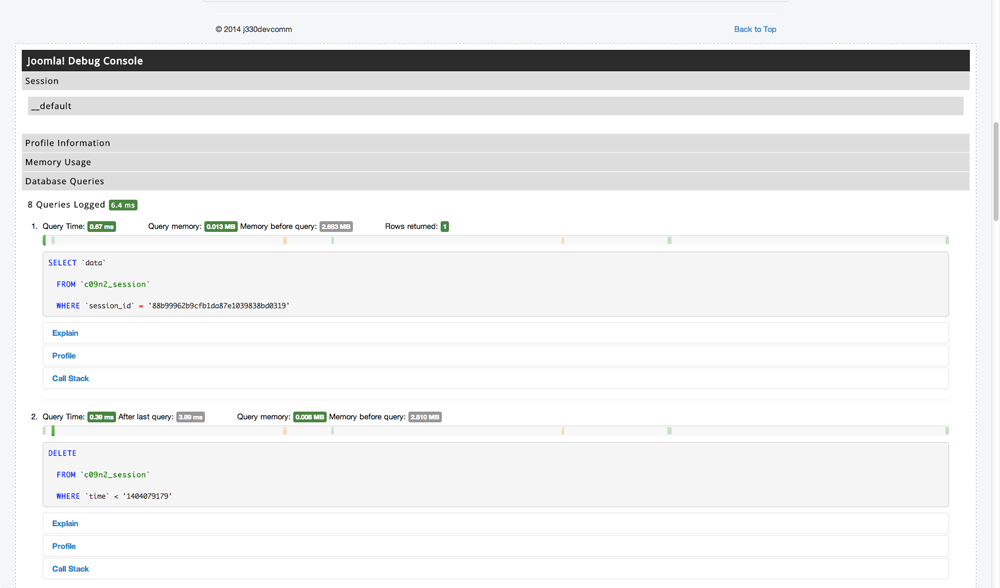
JDEBUG can be enabled from the Joomla! Global Configuration under the System tab. Once enabled the JDEBUG module will be published to the bottom of each page.
This module provides important information that can assist in debugging and improving the performance of your component.
Profile Information[edit]
The Profile Information tab from the JDEBUG module provides information about the time and memory taken to render the page based on each of the application events. This can help to identify areas outside of network speed that are contributing to long page load times high server memory usage.
Database Queries[edit]
One of the most useful tabs is the Database Queries tab. This will provide a log of all queries that have been executed while loading the page and identify both the time taken to execute the query and whether duplicate queries have occurred. This is particularly useful when debugging performance problems on larger components as duplicate queries are often a contributing factor.
JFirePHP[edit]
Use the Joomla JFirePHP extension.


