Difference between revisions of "Debugging a translation"
From Joomla! Documentation
(Remove notice. Just leave JSplit) |
(Several markup corrections.) |
||
| Line 14: | Line 14: | ||
en</translate>.png|right|250px]]<translate> | en</translate>.png|right|250px]]<translate> | ||
<!--T:5--> | <!--T:5--> | ||
| − | + | Activate language debugging in the Administration Backend by going to {{rarr | System,Global Configuration,System tab}}. Go down to ''Debug Language'', change the value to ''Yes''. Then select ''Save & Close''. | |
</translate> | </translate> | ||
<translate> | <translate> | ||
<!--T:6--> | <!--T:6--> | ||
| − | With this option active all translatable strings are shown surrounded with special characters that indicate their status | + | With this option active all translatable strings are shown surrounded with special characters that indicate their status. |
</translate> | </translate> | ||
| Line 49: | Line 49: | ||
<translate> | <translate> | ||
<!--T:13--> | <!--T:13--> | ||
| − | Additional language debugging information can be obtained by activating system debugging. | + | Additional language debugging information can be obtained by activating system debugging. Go to {{rarr | System,Global Configuration,System tab}}. Find the ''Debug System'' option and change the value to ''Yes''. Then select ''Save & Close''. |
</translate> | </translate> | ||
| Line 58: | Line 58: | ||
* <translate><!--T:15--> | * <translate><!--T:15--> | ||
| − | '''Profile information.''' | + | '''Profile information.''' This is the amount of time taken to execute code up to various mark points in the code.</translate> |
* <translate><!--T:16--> | * <translate><!--T:16--> | ||
| − | '''Memory usage.''' | + | '''Memory usage.''' The amount of system RAM used.</translate> |
* <translate><!--T:17--> | * <translate><!--T:17--> | ||
| − | '''SQL queries executed.''' | + | '''SQL queries executed.''' All of the SQL queries executed in the process of building the page.</translate> |
* <translate><!--T:18--> | * <translate><!--T:18--> | ||
| − | '''Language files loaded.''' | + | '''Language files loaded.''' A list of all the language files loaded in the process of building the page, including full path information. This can be useful to check that the expected files have been loaded. The number after each file path is the number of times that the file was referenced.</translate> |
* <translate><!--T:19--> | * <translate><!--T:19--> | ||
| − | '''Untranslated strings diagnostic.''' | + | '''Untranslated strings diagnostic.''' A list of all the untranslated strings found and the likely file location given where the '''JText''' call was made.</translate> |
* <translate><!--T:20--> | * <translate><!--T:20--> | ||
| − | '''Untranslated strings designer.''' | + | '''Untranslated strings designer.''' A list of all the untranslated strings found but listed in a KEY=Value format so they can be copy-pasted directly into a language definition file (INI).</translate> |
<translate> | <translate> | ||
| Line 75: | Line 75: | ||
[[Image:debug-plugin-<translate><!--T:22--> | [[Image:debug-plugin-<translate><!--T:22--> | ||
en</translate>.png|right]]<translate><!--T:23--> | en</translate>.png|right]]<translate><!--T:23--> | ||
| − | This system plugin controls what is displayed when debugging is activated in | + | This system plugin controls what is displayed when debugging is activated in ''Global Configuration''. It is enabled by default. You can access the parameters for the plugin from {{rarr | Extensions,Plugin Manager}}. Locate the ''System - Debug'' plugin and click on it. There are three settings of interest to translators.</translate> |
* <translate><!--T:24--> | * <translate><!--T:24--> | ||
| − | '''Display loaded language files'''. | + | '''Display loaded language files'''. If set to ''Yes'', the debug information will include a list of the language files that were requested as the current page was being generated.</translate> |
* <translate><!--T:25--> | * <translate><!--T:25--> | ||
| − | '''Display undefined language strings.''' | + | '''Display undefined language strings.''' If set to ''diagnostic mode'', a list of untranslated strings and the location of the file containing the call to ''JText'' is included in the debug information. If set to ''designer mode'', a list of untranslated strings in a format that can be copy-pasted directly into a language definition file is included in the debug information. That is, it displays the list in KEY=String format. If set to ''All modes'', both the diagnostic mode and designer mode lists are included in the debug information.</translate> |
* <translate><!--T:26--> | * <translate><!--T:26--> | ||
| − | '''Strip Key Prefix'''. | + | '''Strip Key Prefix'''. Only used when ''Display undefined language strings'' is set to ''Designer mode'' or ''All modes''. This allows you to strip a prefix from the string to form the key. This is useful if the designer uses a common prefix for their extensions when using ''JText'' methods. See example below.</translate> |
<translate> | <translate> | ||
<!--T:27--> | <!--T:27--> | ||
| − | Note that the display of untranslated strings will only display the value passed to the appropriate | + | Note that the display of untranslated strings will only display the value passed to the appropriate ''JText'' method. For example, with the following code: |
</translate> | </translate> | ||
| Line 103: | Line 103: | ||
<translate> | <translate> | ||
<!--T:29--> | <!--T:29--> | ||
| − | If the Strip Key Prefix is set to | + | If the Strip Key Prefix is set to ''Reports'', the display would change slightly to: |
</translate> | </translate> | ||
Latest revision as of 13:53, 6 July 2022
It has been suggested that this article or section be split into specific version Namespaces. (Discuss). If version split is not obvious, please allow split request to remain for 1 week pending discussions. Proposed since 22 months ago.
Joomla supports some useful debugging mechanisms that can make it easier to locate untranslated strings and diagnose problems with language translations in installed extensions.
Debug Language[edit]
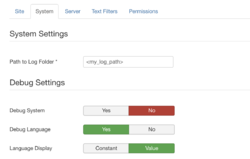
Activate language debugging in the Administration Backend by going to System → Global Configuration → System tab. Go down to Debug Language, change the value to Yes. Then select Save & Close.
With this option active all translatable strings are shown surrounded with special characters that indicate their status.
| Code | Status |
|---|---|
| **Joomla CMS** | (text surrounded by asterisks) indicates that a match has been found in the language definition file and the string has been translated. |
| ??Joomla CMS?? | (text surrounded by pairs of question marks) indicates that the string is translatable but no match was found in the language definition file. |
| Joomla CMS | (text with no surrounding characters) indicates that the string is not translatable. |
Debug System[edit]
Additional language debugging information can be obtained by activating system debugging. Go to System → Global Configuration → System tab. Find the Debug System option and change the value to Yes. Then select Save & Close.
With this option active all screens have additional debugging information at the end of each page. Currently this includes
- Profile information. This is the amount of time taken to execute code up to various mark points in the code.
- Memory usage. The amount of system RAM used.
- SQL queries executed. All of the SQL queries executed in the process of building the page.
- Language files loaded. A list of all the language files loaded in the process of building the page, including full path information. This can be useful to check that the expected files have been loaded. The number after each file path is the number of times that the file was referenced.
- Untranslated strings diagnostic. A list of all the untranslated strings found and the likely file location given where the JText call was made.
- Untranslated strings designer. A list of all the untranslated strings found but listed in a KEY=Value format so they can be copy-pasted directly into a language definition file (INI).
Debug Plugin[edit]
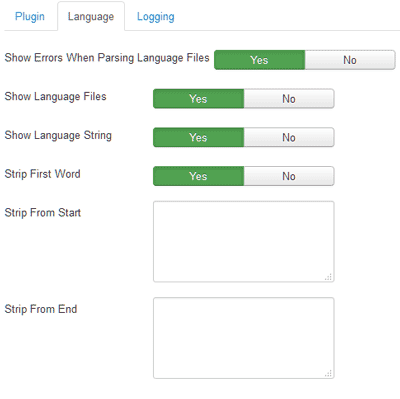
This system plugin controls what is displayed when debugging is activated in Global Configuration. It is enabled by default. You can access the parameters for the plugin from Extensions → Plugin Manager. Locate the System - Debug plugin and click on it. There are three settings of interest to translators.
- Display loaded language files. If set to Yes, the debug information will include a list of the language files that were requested as the current page was being generated.
- Display undefined language strings. If set to diagnostic mode, a list of untranslated strings and the location of the file containing the call to JText is included in the debug information. If set to designer mode, a list of untranslated strings in a format that can be copy-pasted directly into a language definition file is included in the debug information. That is, it displays the list in KEY=String format. If set to All modes, both the diagnostic mode and designer mode lists are included in the debug information.
- Strip Key Prefix. Only used when Display undefined language strings is set to Designer mode or All modes. This allows you to strip a prefix from the string to form the key. This is useful if the designer uses a common prefix for their extensions when using JText methods. See example below.
Note that the display of untranslated strings will only display the value passed to the appropriate JText method. For example, with the following code:
echo JText::_( 'Reports Import Configuration' );If untranslated, Designer mode will display this as:
# /administrator/components/com_reports/views/reports/tmpl/default.php
REPORTS IMPORT CONFIGURATION=Reports Import Configuration
If the Strip Key Prefix is set to Reports, the display would change slightly to:
# /administrator/components/com_reports/views/reports/tmpl/default.php
REPORTS IMPORT CONFIGURATION=Import Configuration
Note that the path shown is only a best guess based on a call to the PHP debug_backtrace function. Sometimes it is accurate, sometimes it is not and there are also cases where no file could be determined. In those cases you have to use your best judgement.

